A 5-Point Framework for Great Small Business Performance Metrics
21/09/2016
Disclaimer: The views and opinions expressed in the following article are those of the guest author and do not necessarily represent or reflect Ryan
One of the many challenges of managing a small business is dealing with the complexities of growth. There are more clients, more employees, more problems, and more decisions to make.
Perhaps trying to keep doing everything on your own does not seem to leave any time for you, or when you try to delegate the tasks, it all seems to fall apart and not end up the way you envisioned.
The solutions to growth challenges often lie within your management system. At the heart of the system are the Key Performance Indicators (KPIs) or the metrics of the business. Teams who are effectively using KPIs will be able to determine trends and act based on performance, while those who do not track KPIs well may be less reactive and miss opportunities available to them.
Finding the Right Mix of Data: Quality vs. Quantity
There is much discussion these days about “big data” – but how does that affect you? According to some, over 95% of generated data goes unused. So how do you make the most of the data that you have without becoming overwhelmed?
Let’s look at a framework for identifying good data and then a concise way to look at that data.
Accessing the Right Data to Guide Management Decisions
The first step involves selecting the “right” data. Don’t be discouraged – there is no “right” data for every organization, at every point in time! In fact, the most important task is to define what is critical by connecting it to your strategy and the priorities for the year. For example, if it is a high growth year, cash flow might be your biggest priority. Isolating this to measuring receivables beyond your 30-day terms might be the metric you track and discuss.
Related Blog: Balancing Your Business’ Definition of Success: KPIs and Team Input
Key questions to ask that will help identify the data to review, and check against the framework above include:
- Experience: What are the three factors I check now to tell me things are ok?
- Stakeholder Impact: What two elements are most important to my customers? My suppliers? My employees?
- Financial Drivers: What are the top three financial drivers? Have I identified a daily input to these, rather than wait for the month end?
- Execution: How do I measure employee performance and satisfaction?
How to Measure the Effectiveness/Utility of KPI Metrics
Even with the short list of KPIs we just generated, your analytics dashboard would have 10-15 key metrics on it. To cut through all of this and pick out the most important details, having a consistent and disciplined framework to look at the data is paramount.
I like to utilize five tests:
- Relevance: Is it important for the business? (You would be surprised how much data fails this simple test!)
- Trend: Can I see and react to a trend, or is it too late?
- Target: Have I defined what success is, and where I need to take action?
- Visibility: Is the data current, and is it readily available to generate discussion and action?
- Simplicity: Can I (or my staff) connect an action to a change in this data?
Data in Action: How to Manage Your Business with KPIs
Here is a simple example of how KPIs can be used to identify and measure strategic direction:
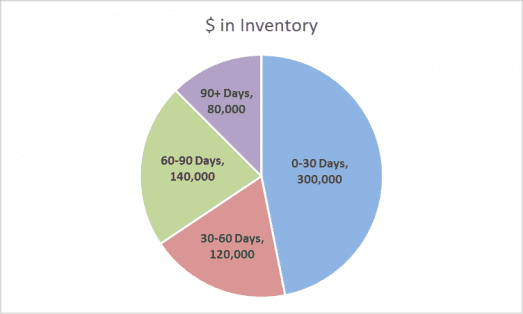
Your shipper brings you a chart like the one below, and says, “We have too much slow moving inventory”. Let’s look at the data provided within the framework above.
- Relevance: Is this critical to reduce now? Am I running out of space, or are my customers negatively impacted?
- Trend: Was there a surge this week? This month? Trends are difficult to discover with pie charts.
- Target: Have I defined my targets for each area? Am I working to reduce sales discounts, or quick changes to reduce set up time?
- Visibility: Your shipper may be right – is it posted on the wall, and do they discuss it every day? Do you celebrate wins?
- Simplicity: Which inventory fits in each bucket? Can I identify that on the floor? Is it grouped/colour coded to match the groups on the chart?
How Does This Align with my Business’ Strategy?
Consider that in the previous scenario, you gained two new accounts because you had inventory on the floor, ready to ship. At that point, does reducing inventory align with your growth priority? How can you achieve inventory readiness at the lowest cost?
Careful selection of the most important metrics and putting them in a framework that drives ownership, action and accountability are critical factors to help you grow and improve your performance leadership.
Recent Leadership and Management News:
[display-posts tag=”leadership-development” posts_per_page=”5″]
Guest Author Profile
Mike Arnew is a management consultant with over 30 years of experience coaching both large and small companies to improve performance. He can be reached at mike.arnew@gmail.com
Subscribe to Funding Updates
Get the top Canadian government funding news, delivered to your inbox. You can unsubscribe at any time.

